Program prioritization—two words that cause trepidation in the hearts and minds of faculty and administrators throughout higher education. Most often undertaken in the face of declining enrollment, increasing costs, and the resulting budgetary shortfalls, program prioritization involves the assessment of programs across a set (or sets) of criteria toward the explicit goal of prioritizing programs for investment, maintenance, reduction, or even elimination.
Over the years, many different fundamental approaches to program prioritization have emerged, e.g., (Texas Higher Education Coordinating Board, 2016), (Debrecht & Levas, 2014), (Udo-Imeh, Edet, & Anani, 2012), (Wells & Wells, 2011)). Perhaps the most commonly followed approach is that presented by Robert Dickeson in his popular book, Prioritizing Academic Programs and Services (Dickeson, 2010). Dickeson’s approach has dominated prioritization efforts in the United States over the last few years (Fannin & Saran, 2017). Dickeson articulates a systematic nine-step process that begins with the identification of responsible leadership and ends with decision making to achieve strategic balance. While every step is important, here we focus on Step 4 – Selecting Appropriate Criteria.
The criteria used, of course, define the value system against which all programs will be judged and through which they will be prioritized. As such, criteria selection is a high-stakes endeavor. Dickeson himself recommends 10 broad areas of criteria ranging from the history and development of the program to its mission centrality and even its opportunities for future contributions not yet realized. Within each broad area, Dickeson illustrates specific possible criteria such as proportion of faculty with terminal degrees, percent of instruction offered by full-time faculty, coherence of the curriculum, and so on. The list of possible criteria is massive but Dickeson’s intent is to stimulate consideration, to open the readers’ eyes to the world of possibilities, not to mandate every possibility’s inclusion. Open our eyes it did.
Why Use Racial/Ethnic Equity in Program Prioritization
A fair question and one that was asked by our Board of Trustees when the criteria were first shared. We have a moral and economic obligation to address equity in higher education. Morally, we equitably admit students, and we equitably charge students, thus we should expect to have equitable student success. There is no excuse. Economically, students of color are an ever-expanding segment of the college-going population. Estimates suggest that people of color will become the majority in the United States by 2045 (United States Census Bureau, 2017). To survive, let alone thrive, institutions of higher education must demonstrate equitable success for all students including students of color. With the current consumerism mindset toward higher education (Armstrong, Smith, Thomas, & Johnson, 2015), student populations who do not see equitable outcomes are less likely to enroll (Baker, Klasik, & Reardon, 2018). Further, unless equitable outcomes can be achieved, even when students of color choose to attend an institution, equity gaps will make it far less likely that those students will be successful and retained to graduation.
Defining the Criteria
In considering how to approach program prioritization at our institution and using Dickeson’s book as a guide, we chose to focus on an almost exclusively student-oriented approach. We considered student inputs like high school grade point averages for incoming majors and student outputs like retention and graduation rates, and student demand like the number of incoming first-year student majors and incoming transfer student majors. Missing were the standard faculty-oriented measures like publications produced and the broad philosophical measures like mission centrality. We categorized all metrics under three broad areas: effectiveness, efficiency, and equity.
Effectiveness covered metrics that demonstrated each program’s ability to achieve goals important to the future of the college. Efficiency measured program effectiveness per unit of resource invested. Equity measured the extent to which a program demonstrates equity in student opportunities and success. It is this last broad area of metrics that serves as the focus of this manuscript.
Table 1 lists the 35 metrics we used for program prioritization across the three categories of effectiveness, efficiency, and equity.

Table 1: Metrics used for academic program prioritization (click for full-size table)
Since the focus of this manuscript in on the equity metrics, we provide a full definition of each metric in Table 2. The desired benchmark for all equity metrics is that each difference described below is zero.

Table 2: Equity metric definitions (click for full-size table)
Using the Metrics to Priority Rank Academic Programs
We collected three years of student performance data broken down by academic program and used the average of the three years as each program’s metric score. Each metric was given a relative importance from zero (not important) to 4 (very important). Metric importance was not varied by program but set once for all 41 programs. Programs were computationally placed in quintiles of performance on each metric (1 being the worst quintile and 5 being the best). The weighted average of the thirty-five quintile scores defined each program’s overall score. The priority ranking of the programs was based on the descending order of scores.
Here is where we depart from our institution’s actual program prioritization process and begin to consider the impact of hypothetical approaches, with and without equity, using actual data from our process. For example, in our actual program prioritization process, programs were asked to submit narrative responses to their program’s scores and the narrative responses were used to manually and subjectively adjust the final priority rankings. However, for the purpose of illustrating the hypothetical impact of equity metrics for the manuscript, we have used the original quantitative rankings as the final rankings.
Traditional Effectiveness and Efficiency Rankings Versus Equity Rankings
The traditional set of program prioritization metrics focus on effectiveness and efficiency (in addition to other categories not represented in our approach). Figure 1 illustrates the priority rank ordering of the programs based on effectiveness and efficiency combined (the traditional approach), effectiveness alone, efficiency alone, and equity alone with all metrics of equal importance weighting. To protect individual programs, we use aliases rather than actual program names. In Figure 1a, programs appear in rank order (highest rank at the top) and are shaded based on rank. The shading of the programs is maintained in the other portions of the figure to allow for direct comparison.
Notice that “effectiveness alone” and “efficiency alone” are relatively consistent with one another. To be sure, there are some dramatic variations but the general pattern moves darker to lighter. Contrast that similarity with the “equity alone” ranking; the pattern is far more dispersed with the highest priority positions largely occupied by the lighter programs. The contrast is even more evident when we consider only the top half of the programs as shown in Figure 2.
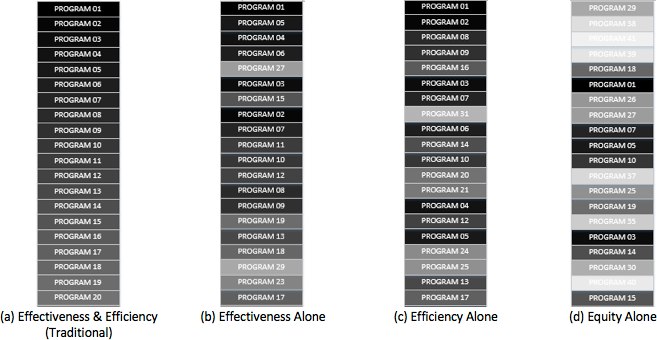
Figure 2: comparison of the top half of program rank order (click for full-size figure)
However, we don’t need to rely solely on visual similarity. Kendall tau distance is a well-established means of measuring the difference between two rankings (Kendall, 1938). Essentially, the Kendall tau distance counts the number of pairs of values that are in different order between two rankings: the larger the distance the more different two rankings. Using the (a) ranking as the starting point, the Kendall tau distance from (a) to (b) is 123. The Kendall tau distance from (a) to (c) is 154. The Kendall tau distance from (a) to (d) is 411, meaning equity is almost three times more dissimilar to effectiveness & efficiency than either effectiveness or efficiency alone. Equity, unlike effectiveness and efficiency, provides a distinctive new lens through which to view the prioritization of programs.
Using Equity to Preserve an Inclusive Curriculum
Understanding that the equity perspective gives a unique view of each academic program, how do we use that perspective in the overall prioritization process? An obvious choice is to simply add the equity metrics to the effectiveness and efficiency metrics and rank based on the results. Again, assuming we assign equal importance weights to all metrics, the resulting ranking is shown in Figure 3(b).
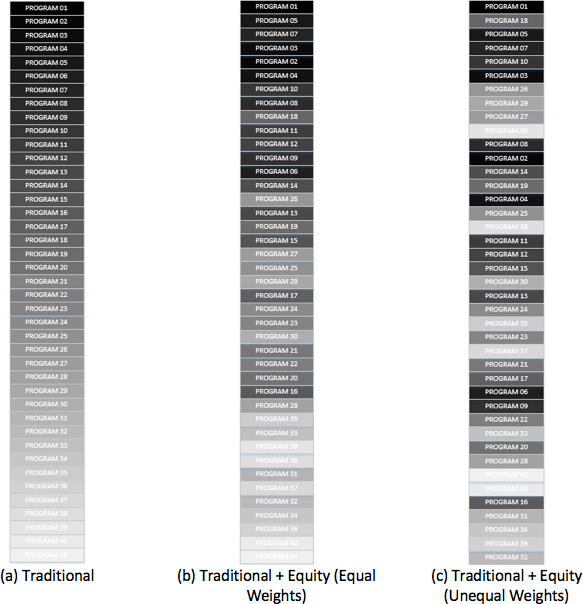
Figure 3: Comparison of the traditional ranking with those that include equity (click for full-size figure)
Perhaps surprisingly, the resulting ranking (b) is more similar to the traditional ranking than are either the “effectiveness alone” or “efficiency alone” rankings (the (b) ranking has a Kendall tau distance from (a) of only 104). This might suggest that adding the equity perspective to the traditional approach would have little actual consequence. However, Figure 3(c) considers the impact of heavily weighting the equity metrics compared to lightly weighting the traditional effectiveness and efficiency metrics. This new ranking has a Kendall tau distance from (a) of 253, possibly making it a good compromise between the traditional ranking and the “equity alone” ranking.
To understand the consequence of any of the ranking, we must establish what curricular changes will be made as a result of the ranking. At our institution, as with most institutions, program prioritization was undertaken as a means of resource reallocation, the most extreme of which involves complete program elimination. For us, this would mean that hypothetically, roughly one-third (14) of the programs in the original program array (41) would be eliminated, leaving a revised program array of 27 programs.
If we simply follow the numeric rankings, very different hypothetical program arrays result depending on which ranking is selected. We could measure the desirability of the resulting program array in many different ways. We initially measured the desirability of the program array based on the distribution of the students impacted by the eliminated programs. In particular, we measured the proportion of students of color for each resulting program array as shown in Figure 4. Ideally, we sought to have the student enrollment in the resulting programs as close as possible to the overall student enrollment distribution.

Figure 4: Comparison of intended majors in program arrays (click for full-size figure)
Notice that the traditional ranking, which ignores equity, underrepresents students of color in the resulting program array. Surprisingly, simply adding the equity metrics and maintaining all metrics with equal weights, even further underrepresents students of color. However, by heavily weighting (very important) the equity metrics and weighting the other metrics lightly (slightly important), the resulting program array almost exactly mirrors the institution’s overall proportion of students of color. In other words, the elimination of programs has the same relative impact on students of color as it does on majority students, neither advantaging or disadvantaging either population.
Discussion
In the previous section, we demonstrated how incorporation of equity considerations in program prioritization can be used to understand and control the equitable impact of any resulting program eliminations. That said, is the resulting program array still viable in terms of effectiveness and efficiency? After all, prioritizing equitable impact might not be worth it if the overall resulting curriculum isn’t otherwise satisfactory.
Throughout this section, we use the term “traditional” program array to refer to the hypothetical 27-program array that results from following the rankings based on effectiveness and efficiency, all with equal weights. We use the term “equity” program array to refer to the 27-program array that results from following the rankings based on all three categories with equity having the heaviest weight. “Original” refers to the full set of 41 programs involved in the analysis.
Effectiveness
To address the impact on effectiveness, we consider two of the most critical effectiveness metrics for both the original program array and the program array resulting from consideration of equity: incoming student interest and outgoing degrees granted.
Incoming Student Interest
In considering incoming student interest, our institution collects only student interest in majors (not minors). Therefore, for this analysis, we will limit our considerations to majors alone; we have a total of 30 majors in the original program array. Figure 5 shows the performance of the traditional and equitable program arrays.

Figure 5: Comparison of intended majors in program arrays (click for full-size figure)
The leftmost graph shows that the equity program array retains more of the original major programs but fewer of the minor programs (not shown). However, the adjacent graph shows that the traditional program array retains more of the students (measured by the number of students whose intended major is in a retained program). That said, both approaches retain over 90% of the students. With the traditional approach, the intended majors of majority students are retained at a slightly higher rate (94%) than those of students of color (93%). With the equity approach, this gap is reversed (89% for majority students compared to 92% for students of color).
The dark horizontal line indicates the percent of the overall intended major students who are students of color. The traditional approach holds that percentage steady whereas the equity approach increases it slightly.
Degrees Granted
Again, focusing only the majors and not the minors awarded, Figure 6 summarizes the performance of both approaches. Again, the traditional approach retains more overall credentials awarded than the equity approach (88% versus 86%, left panel). The traditional approach, surprisingly, retains a slightly greater percentage of the credentials awarded to students of color (89%) than it does for majority students (88%). The equity approach maintains 85% for majority students but increases the percentage of the credentials awarded to students of color to 90%. Again, these are relatively small variations.

Figure 6: Comparison of degrees granted in program arrays (click for full-size figure)
The dark horizontal line indicates the percent of the overall credentials retained that are earned by students of color. Again, the traditional approach holds this percentage steady while the equity approach increases it slightly.
Overall, the data in Figures 5 and 6 show a level of consistency between the traditional and equity approach, with the equity approach seemingly trading a slightly lower overall retention of students but a more equitable impact. Is this tradeoff worth it? That is a question for each institution. However, we believe it should be made based on intentional values. We see the equity approach as more valuable.
Efficiency
To consider the efficiency of the original program array compared to the traditional and equity program arrays, we again use our two most salient metrics: degrees granted per full-time faculty equivalent (FTE) and total enrollment taught per faculty FTE. These two metrics most closely approximate cost efficiency of the program array measured in faculty lines versus actual dollars. Of course, in looking at efficiency, we do not disaggregate enrollment by race/ethnicity. The original program array produced an average of 469.67 credentials (majors only) with 99.64 faculty FTE for an average of 4.71 credentials per FTE. This compares to 5.43 credentials per FTE for the Traditional approach and 5.04 for the Equity approach.Table 3 presents all the efficiency measures for the three program arrays and the percent of improvement over the original program array demonstrated by the traditional and the equity approaches.

Table 3: Key efficiency measures for the program arrays (click for full-size table)
Both the traditional and equity approaches result in a more efficient program array than the original. However, the traditional approach is more efficient than the equity approach. In looking at the source data, we found that students of color are disproportionately attracted to smaller programs and that these smaller programs tend to have lower overall efficiency. The question is if the institution values increased efficiency above increased equitable student impact.
Summary and Conclusion
In this manuscript, we presented a case study in the use of racial/ethnic equity data in program prioritization. We have presented comparisons between an approach that incorporates equity versus an approach that only considers traditional measures of effectiveness and efficiency. We have used data from our own recent program prioritization process to analyze the program arrays that would result from using each prioritization as the basis for program eliminations. Our analysis shows that use of equity results in modifications of the curriculum array that have equitable impact on majority students and students of color, while having only a small impact on the resulting program array’s effectiveness but a larger impact on efficiency. We believe that benefits (moral and economic) that results from the equitable treatment of student populations more than outweighs the loss in efficiency gain.
References
Armstrong, A., Smith, M., Thomas, J., & Johnson, A. (2015, April 1). Consumerism and Higher Education: Pressures and Faculty Conformity. The William & Mary Educational Review, 3(2).
Baker, R., Klasik, D., & Reardon, S. (2018). Race and Stratificiation in College Enrollment Over Time. AERA Open, 1-28.
Debrecht, D., & Levas, M. (2014). Using the Boston Consulting Group Portfolio Matrix to Analyze Management of a Business Undergraduate Student Program at a Small Liberal Arts University. Journal of Higher Education Theory and Practice, 3-11.
Dickeson, R. C. (2010). Prioritizing Academic Programs and Services (Second ed.). Jossey-Bass Inc./John Wiley & Sons, Inc.
Fannin, W., & Saran, A. (2017). Strategic Academic Program Prioritization: In Theory and Practice. International Journal of Business and Public Administration, 14(11), 23-35.
Kendall, M. G. (1938). A New Measure of Rank Correlation. Biometrika, 30(1/2), 81-93.
Texas Higher Education Coordinating Board. (2016, November 8). Retrieved from http://www.thecb.state.tx.us/index.cfm?objectid=9B488705-FA7E-5ACB-C8ED111CBC477B33
Udo-Imeh, P. T., Edet, W. F., & Anani, R. B. (2012). Portfolio Analysis Models: A Review. European Journal of Business and Management, 4-18.
United States Census Bureau. (2017). 2017 National Population Projections.
Wells, R., & Wells, C. (2011). Academic Program Portfolio Model for Universities: Guiding Strategic Decisions and Resource Allocations. Research in Higher Education, 1-19.
Related topics: equity | program prioritization
